Today and tomorrow
Think Harvey‘s flooding was bad? Just wait until 2100. (Scientific American 21.11.2017)
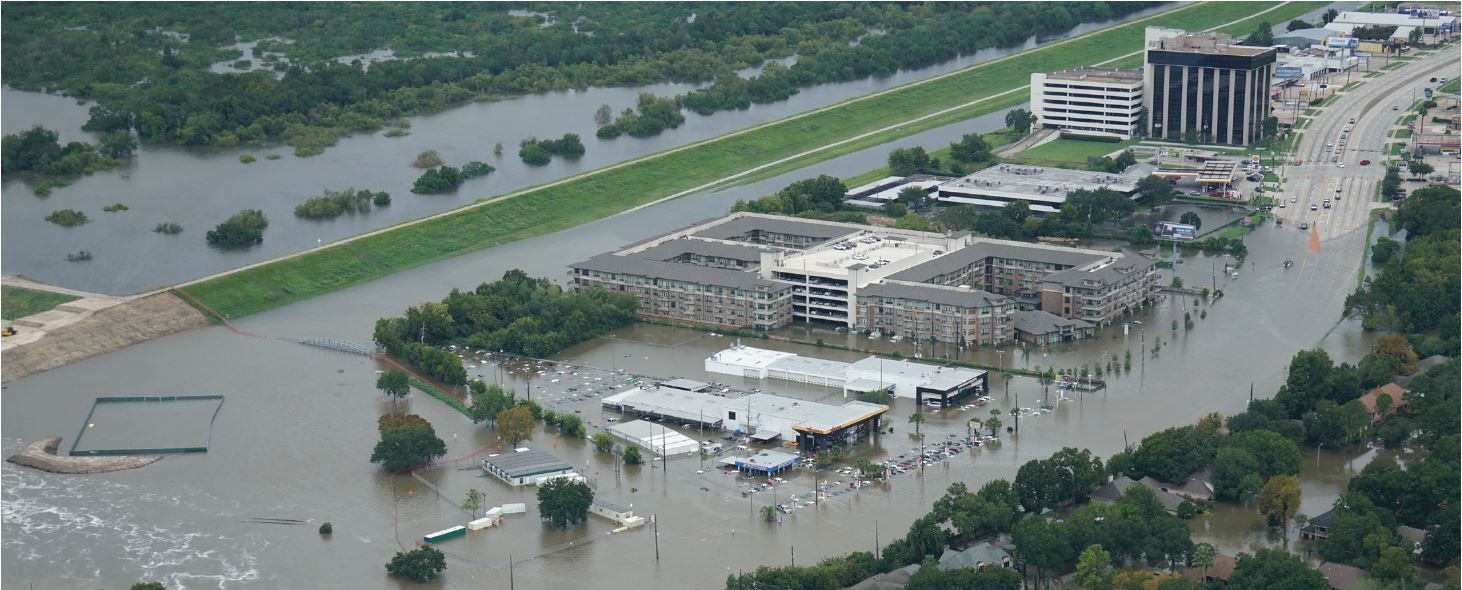
Fig. 1 Flooded Streets in Houston, Texas
Reports on heavy rainfall events are becoming increasingly frequent. Hence why this K.A.R.L. Insight takes the opportunity to take a closer look at this phenomenon. Remembering Hurrican Harvey back in 2017, it did not attack the Texan metropolis of Houston with exorbitantly high wind speeds, no, it was the heavy and never-ending rain that devastated the city. The statistical frequency analysis of precipitation recorded in Houston shows it clearly: this event, at just under 800 mm within 3 days, surpassed almost everything that this city had to endure in heavy rainfall in more than the last 40 years, almost twice as much. So the questions arise:
What is currently possible?
Which amounts of rain must be expected in the future?
The precipitation triggered by Harvey is classified as a millennium event. But how could such extreme precipitation develop? It is important to note, that such an extremely rare event can only arise if – as in this case – several unfavorable factors coincide:
A distinct high-pressure area over the North American continent blocked Harvey‘s path north, leaving the storm stable over the Texan coast, constantly delivering its masses of rain, like a sort of horizontal paddle wheel, to one and the same spot. Unfortunately, the southern half of the storm vortex remained just above the very warm waters of the Gulf of Mexico, allowing the hurricane to draw on a steady supply of warm and humid air for several days (Figure 2).
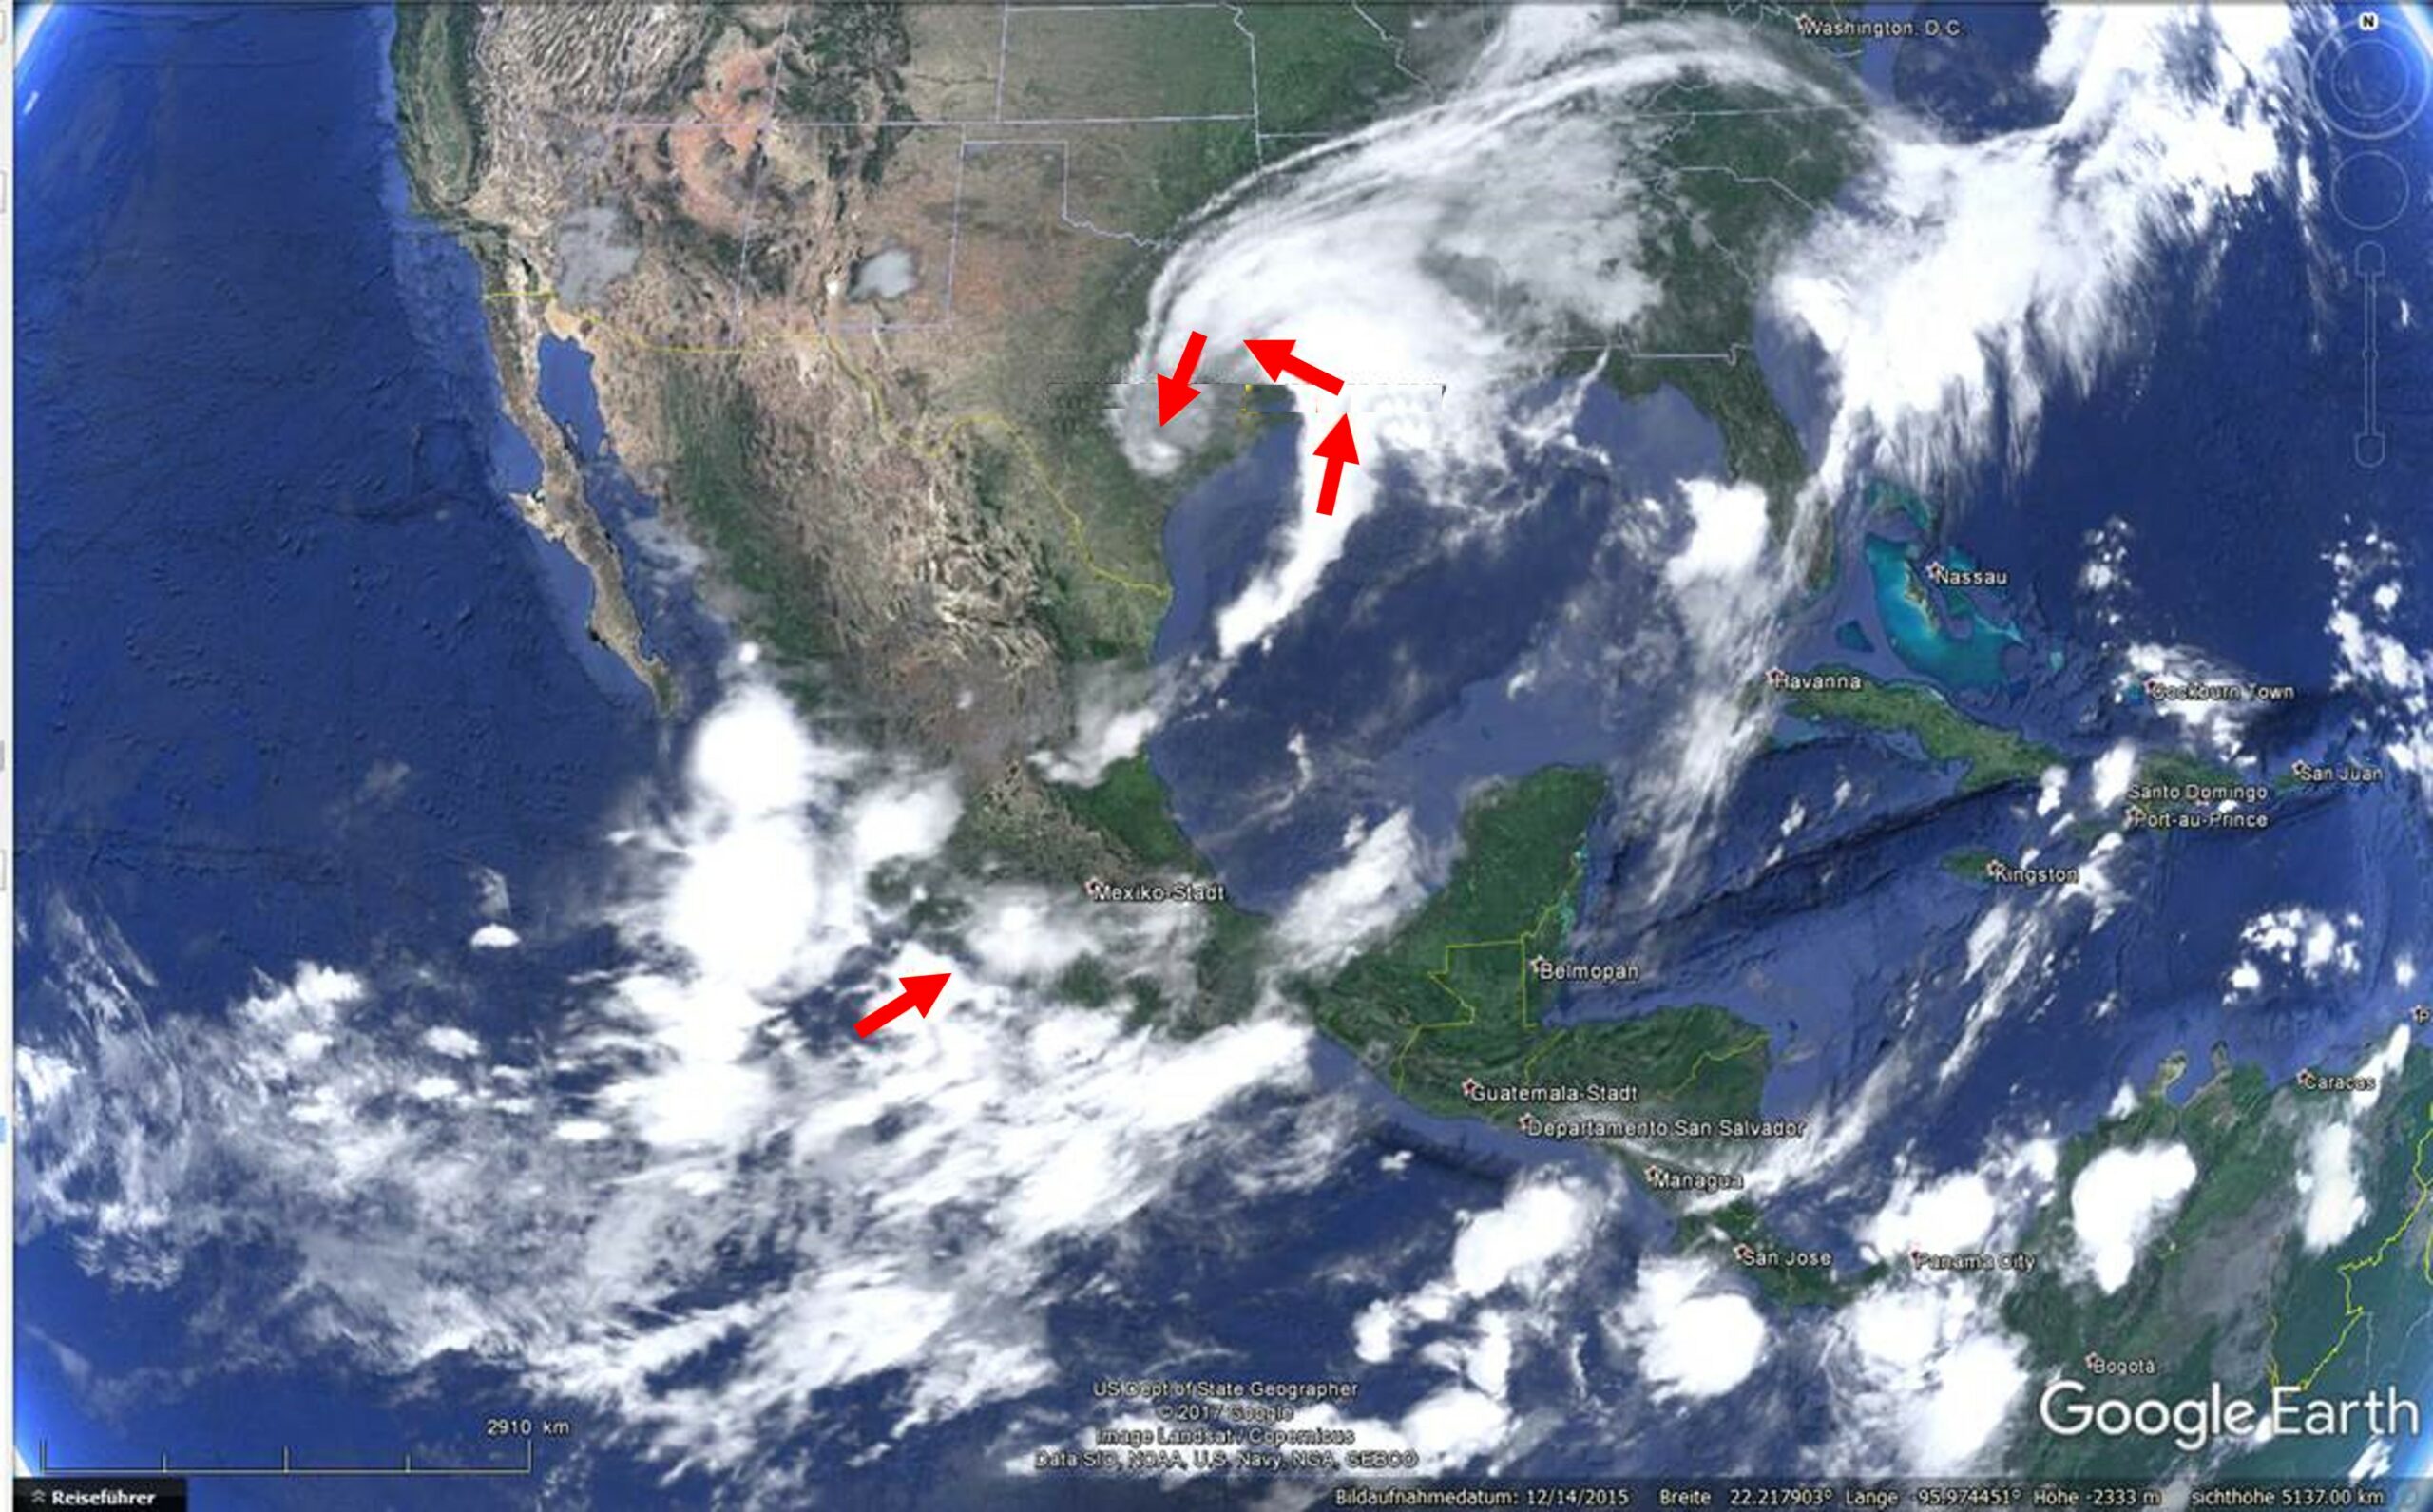
Fig.2 Weather conditions over Central-/North America on 25.08.2017
Such concatenation of unfavorable circumstances can neither be planned nor calculated accurately. However, they are not an analytically easy to solve problem, but are a case for statistical considerations and analyzes.
A bit of theory
The maximum precipitation that can rain down over a particular location is easy to calculate: According to physical laws, it results directly from the temperature of the air column above that location, because the warmer the air, the more water it can absorb and consequently – theoretically – also give it back directly. Climatologists conclude that climate change will lead to more frequent and heavy downpours, because warmer air can store more water.
Whether at a specific point on the world map the air actually absorbs the water and releases it in the same amount as it theoretically could, is another matter, because there are a lot of dependencies and limiting factors:
- The annual average temperature must be used as a limiting factor, because where it is too cold, the air cannot store enough water to produce a veritable heavy rainfall.
- In desert areas, the air is hot enough, but the general supply of water is too low to „feed“ the air to the saturation limit. Extreme heavy rainfall is therefore rare, if not impossible.
- Whether one is in dry zones, the temperate zones or tropical regions, can be read out of the average annual precipitation. Maximum daily precipitation, as is possible in the Southeast Asian monsoon areas, will hardly be found in Europe or Siberia.
- The proximity to the open sea also plays a big role, because over the oceans most of the clouds are created, which then rain down a little further inland. The more you get away from the sea, the more likely it is that the clouds have already done their work and have left little room for extreme precipitation.
For the stations shown in Fig. 3, statistical frequency analyzes were performed on the daily precipitation (see Fig. 4). In the vast majority of cases, the frequency distribution of precipitation above the return period (RP) of one year can be approximated by a straight line that can be extended to the 10,000-year event, which is a common mathematical procedure, to get an idea of the 100-, 500- or 1,000-year precipitation events. However, under the current global climate conditions, the 10,000-year event is likely to be the absolute maximum that should be considered in the present context.
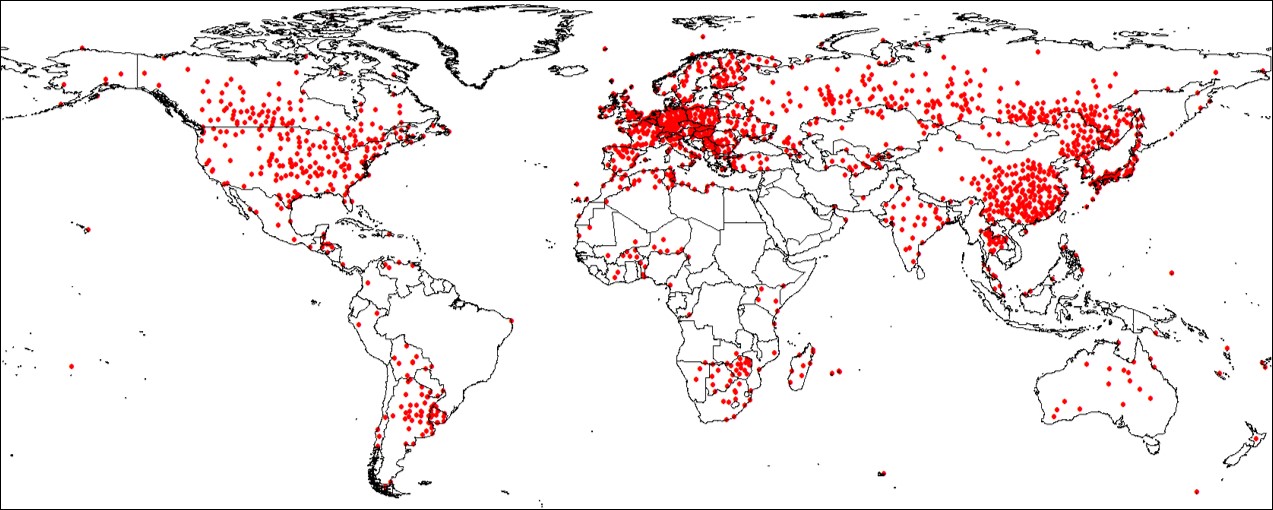
Fig. 3 Map of weather stations used for analysis worldwide
Precipitation extremes
The driest part of the world, the Atacama Desert, has a precipitation of 0.1-12 mm throughout the year. Somewhere in the middle of the scale is Cologne with 769 mm annual precipitation. The absolute peak is Cherrapunji in India with an annual precipitation of 11,439 mm. Paradoxically, people there suffer from (drinking) water shortages. Due to the deforestations, the soil cannot absorb the amounts of precipitation, as a result all the water flows away and too little new groundwater can form.
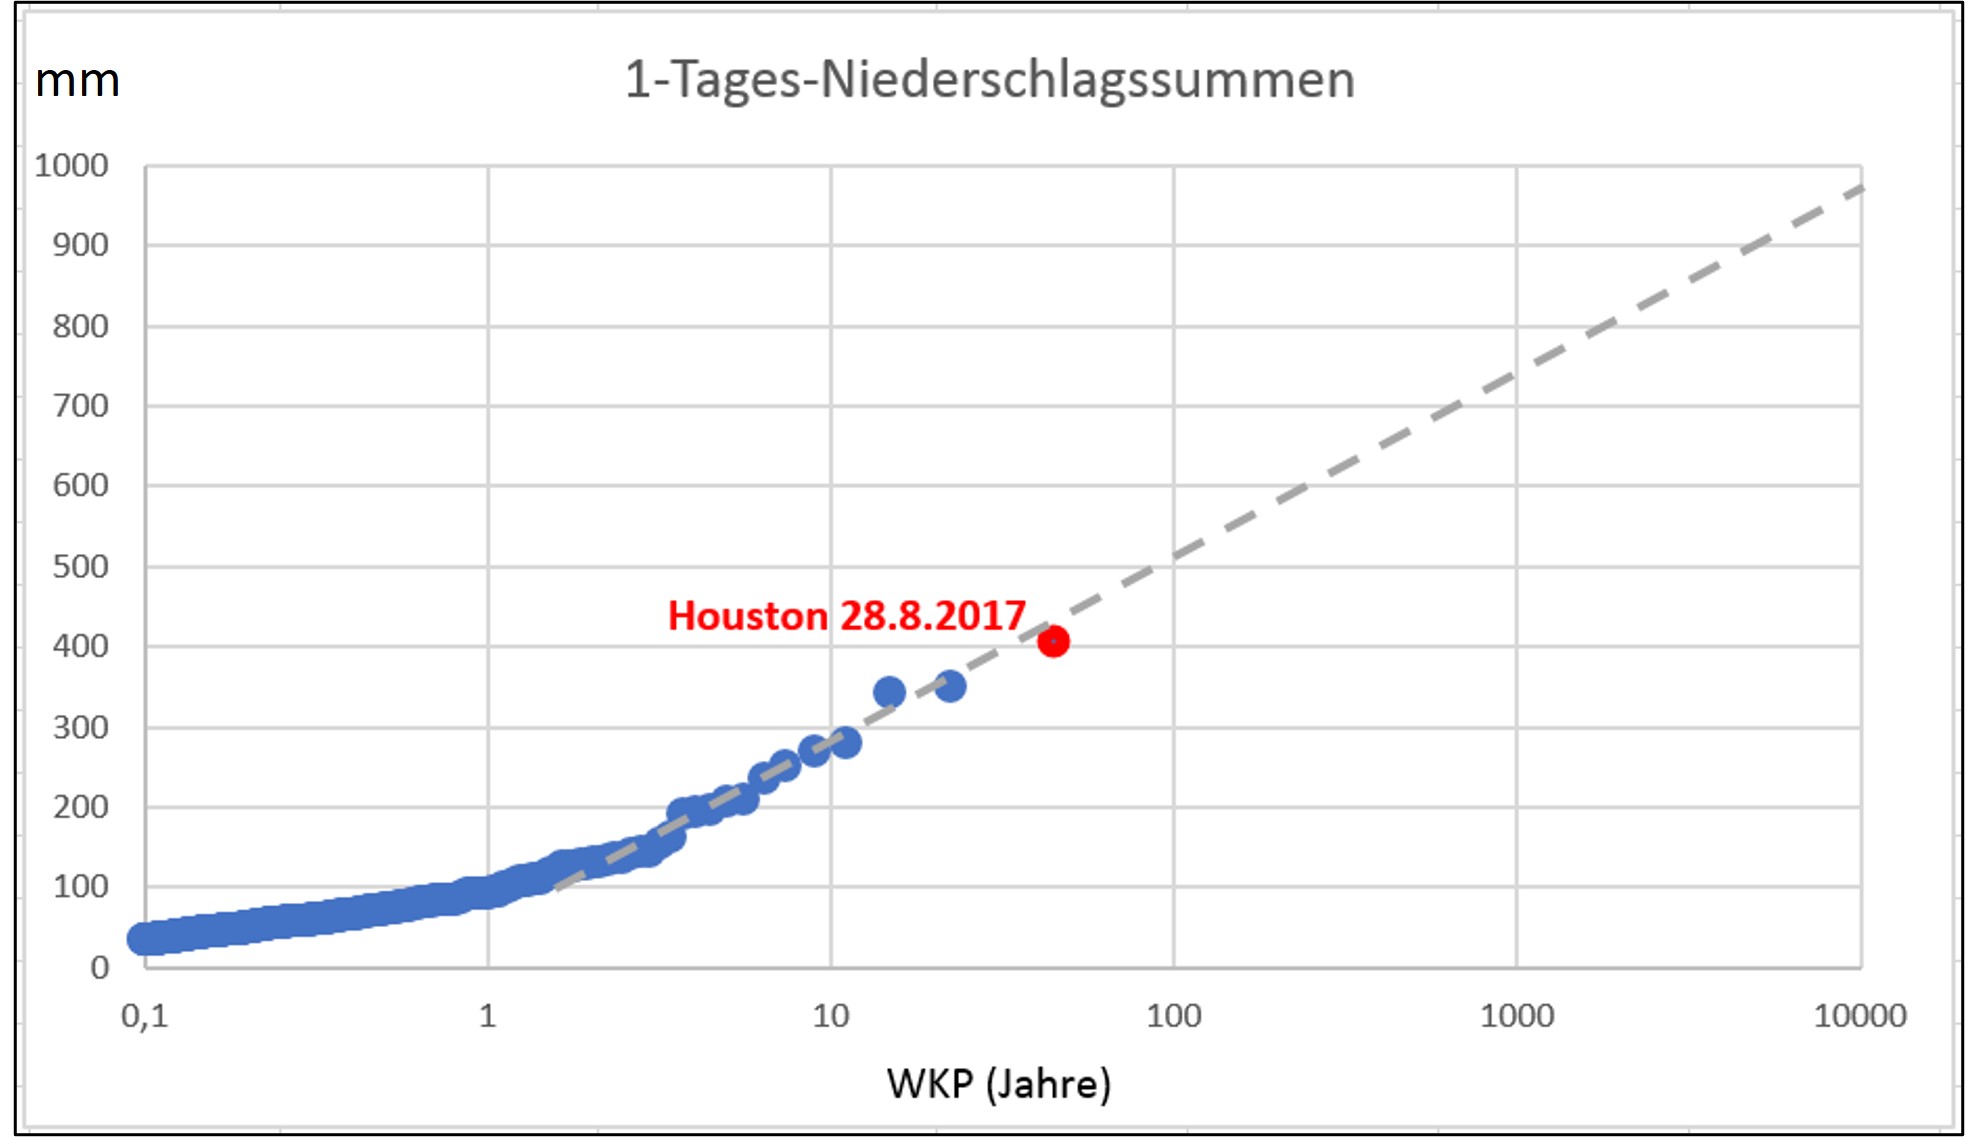
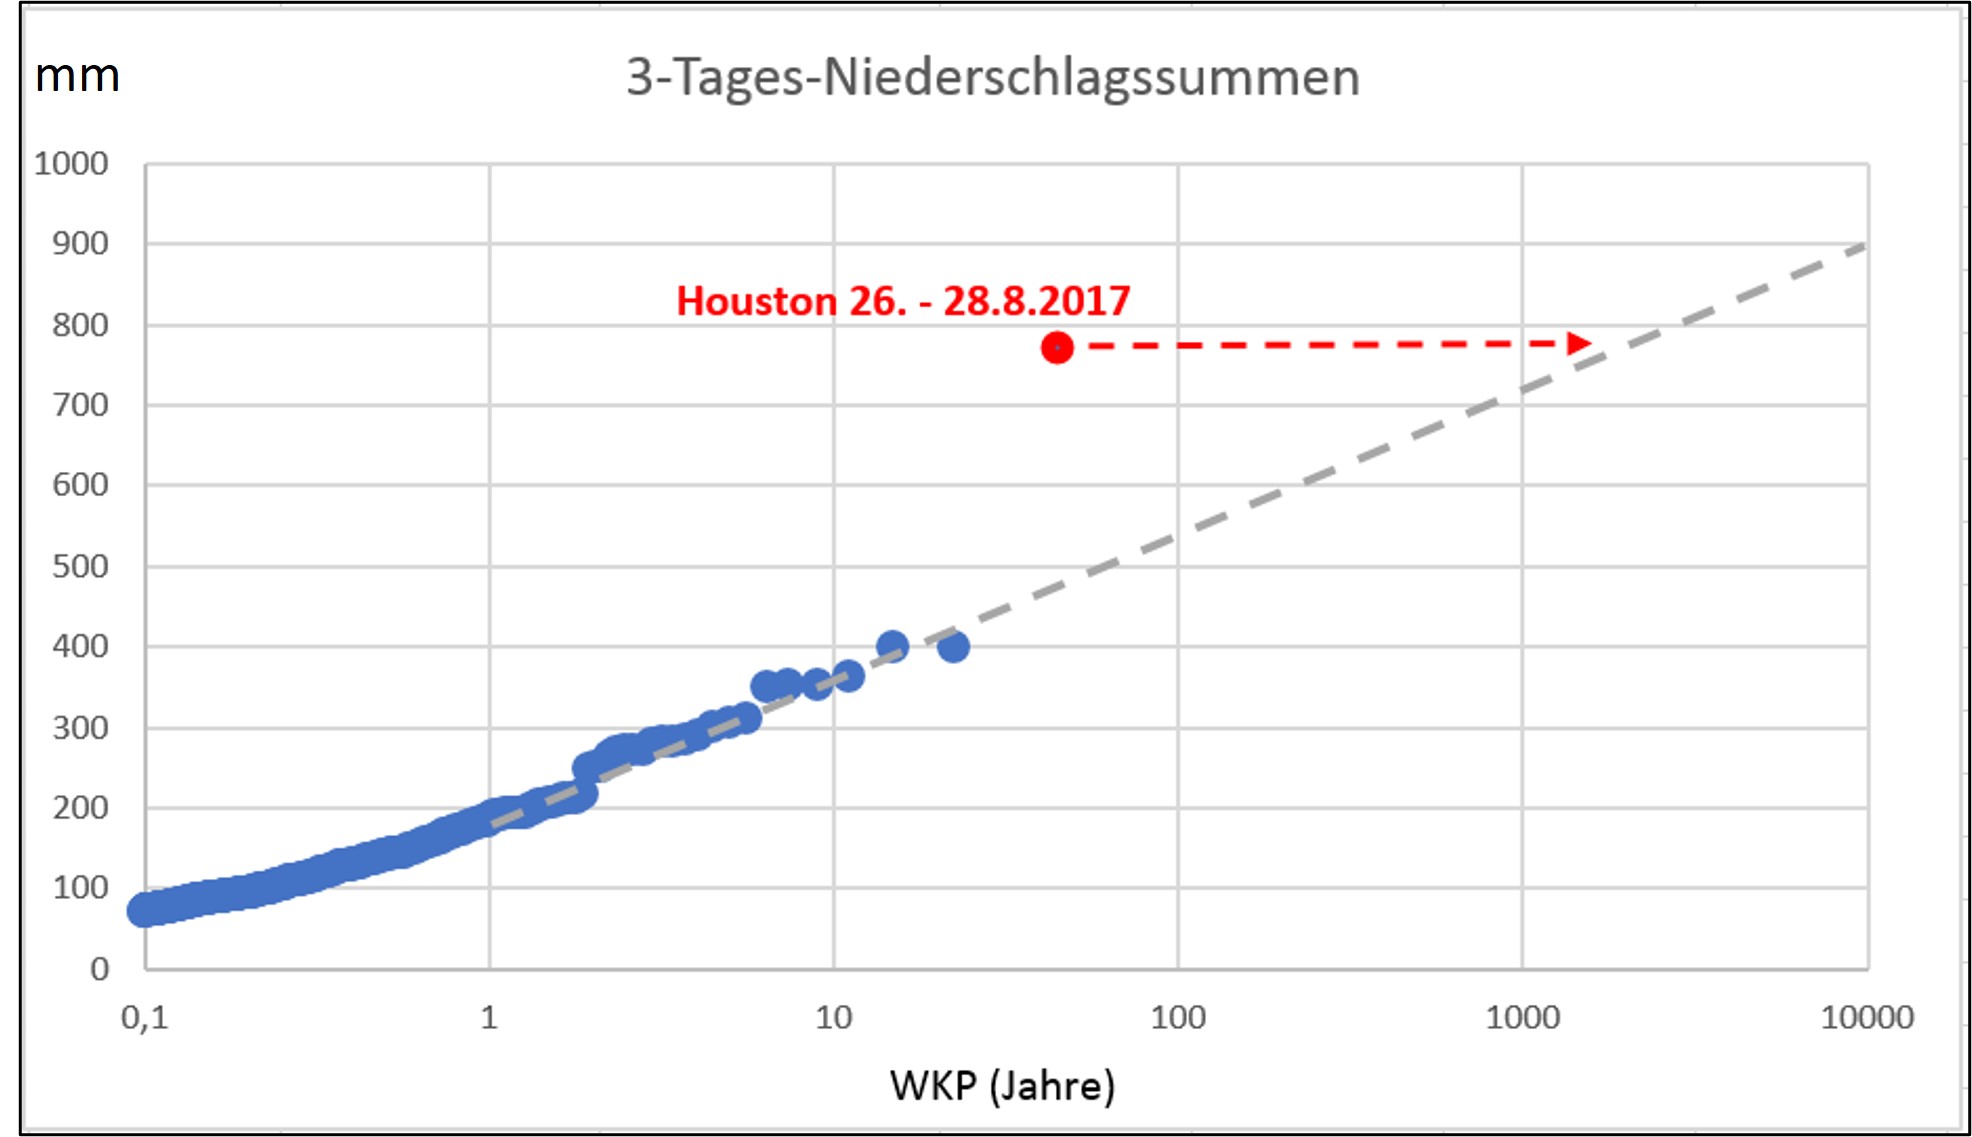
Fig. 4 Measured and extrapolated precipitation totals for Houston, TX
As can be seen in Figure 4 (top), the precipitation in Houston, TX on August 28, 2017 – with 408 mm, after all, the wettest day of the last 44 years – was basically nothing special. The day fits seamlessly into the frequency distribution as a 40- to 50-year event. Only when examinating the precipitation of three consecutive days, does it appear that something has occurred here, that has never happened before in the Houston area: the aggregated precipitation in the days from 26th to 28th August with 792 mm surpasses almost twice of all other 3-day precipitation totals that have been recorded up to today (Figure 4 below).
It would therefore correspond approximately to (!) a 1,000 to 2,000-year event by shifting the corresponding red dot to the right to the extrapolated straight line. But it is also obvious that – at least in Houston – there is no big difference between the precipitation brought by Harvey and the extrapolated 10,000-year 3-day rain of 900 mm. Both values are only slightly more than 100 mm precipitation level apart.
It is also noticeable that the extrapolation of the 1-day precipitation totals also targets the area around 900 to 1,000 mm. Therefore it is quite conceivable that the masses of water, which spread over 3 days in August 2017, could also have gone down on a single day.
For further research on the possible maximum precipitation, the extrapolated 10,000-year daily precipitation of 1,732 measuring stations was chosen as the starting point.
What is currently possible?
Now the limiting factors mentioned above are taken into account. For this purpose, the statistically extrapolated 10,000-year daily precipitation (N10,000) are plotted in different diagrams against a limiting factor. The following were investigated: annual mean temperature, annual precipitation, difference from maximum to minimum average monthly precipitation, lightning activity and the distance of the station to the coast. Two of the resulting diagrams are shown in Fig. 5 as an example.

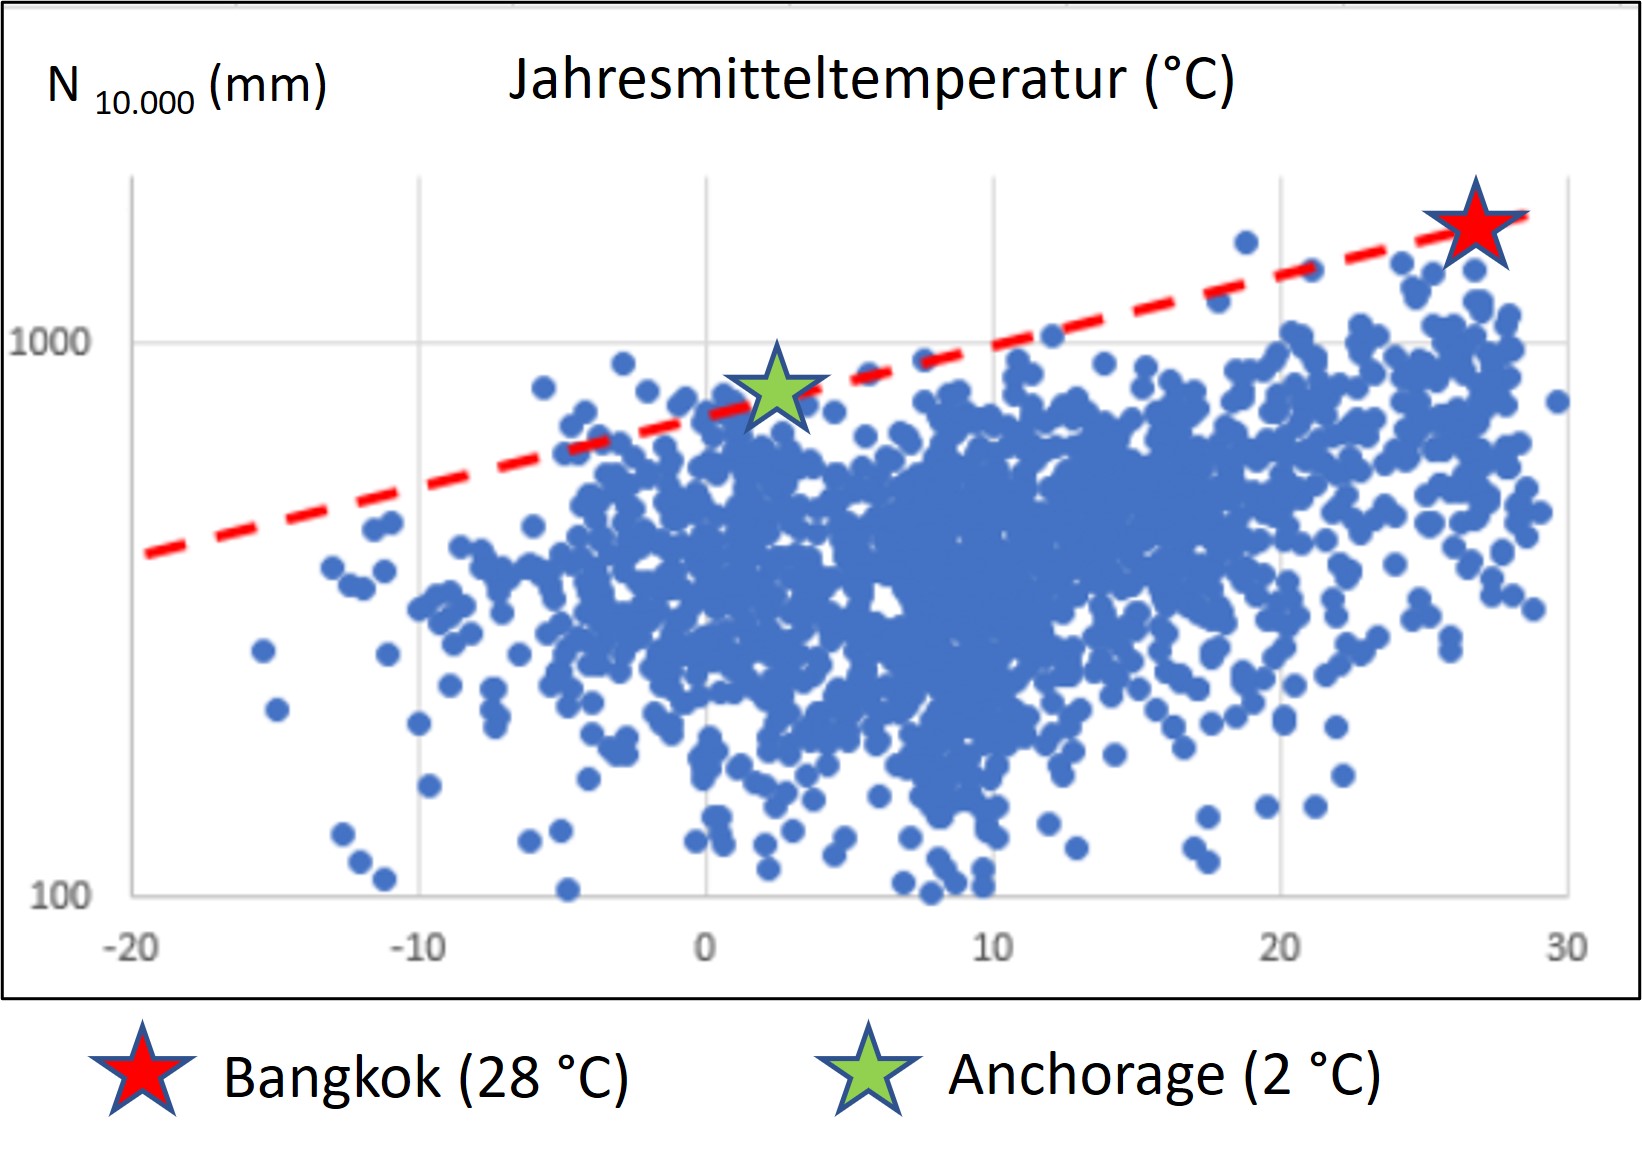
Fig. 5 Sample charts for Bangkok and Anchorage
It showed that the N10.000 values react as expected to all investigated limiting factors: Each parameter shows an upper limit that collects more than 99 percent of the N10.000 values and that under certain, natural conditions obviously can not be exceeded. This can be explained in more detail by means of two examples and the two parameters selected as examples shown in Fig. 5:
Both the Thai metropolis of Bangkok and the city of Anchorage in Alaska are located directly by the sea and therefore, according to Fig. 5 (left), both have to expect a maximum N10.000 value of about 1,500 mm (readable at the red dashed curve). Since Bangkok also has a mean annual temperature of 28°C, this value is not undercut in the right diagram. The possible maximum precipitation of 1,500 mm per day is thereby confirmed.
The situation is different in the city of Anchorage (Alaska), which, on the one hand, also lies directly on the sea, but on the other hand, with an annual average temperature of only 2°C, allows only a N10,000 value of 750 mm. Because, in addition to the two factors shown in Fig. 5, yet other of the above parameters are similarly reducing, so that Anchorage ultimately achieves a N10.000 value of only 533 mm.
The result of the calculations is displayed in a world map of the maximum possible heavy precipitation (see Fig. 6). For Houston, this statistical model provides a maximum precipitation value of just under 1,000 mm, without the use of real measured precipitation data, which corresponds quite closely to the analyzes of the measured data shown in Fig. 4.

Fig.
6 Map of the calculated maximum possible heavy precipitation
However, the extreme precipitation shown in Fig. 6 is unlikely to be achieved in reality. The 10,000-year event is by definition a very rare event. Probably no more than a handful of actual 10,000-year precipitation events are hiding in the analyzed database of 22,622,100 samples. The model represents a valuable base, which considerably extends the statistical analysis of real measured precipitation data, naturally limited to a few decades, to higher recurrence periods. It helps you to more accurately estimate what amounts of precipitation you need to associate with a 100-, 500-, or 1,000-year event anywhere. In particular, the risks that arise in regions prone to floods can be significantly narrowed down in this way. The same applies to regions with an unfavorable topographical situation due to limited drainage possibilities, which also have to deal with floods caused by heavy rain even far away from water.
Therefore, we will soon provide a correspondingly refined analysis method in K.A.R.L.
Which amounts of rain must be expected in the future?
The extrapolated N10.000 values shown in Fig. 5 are plotted along a logarithmically divided Y axis. This is the only way to describe the identified trends mathematically. Against the background of global climate change, this could have serious consequences, in particular for the parameters annual mean temperature, annual precipitation and lightning activity, since even slight changes can lead to strong shifts along the illustrated boundary line.
As you can see in Fig. 7 the example of Houston shows the effect: even a relatively small climate-related increase in the N10,000 value from 900 to 1,000 mm could lead to a „steeper“ extrapolation (red line), the point of the rain event of August 2017 would have to shift significantly to the left. A hitherto 2,000-year would suddenly make an 800-year event. In plain language, the risk of such extreme precipitation would increase by a factor of 2.5 in Houston, that is more than double.
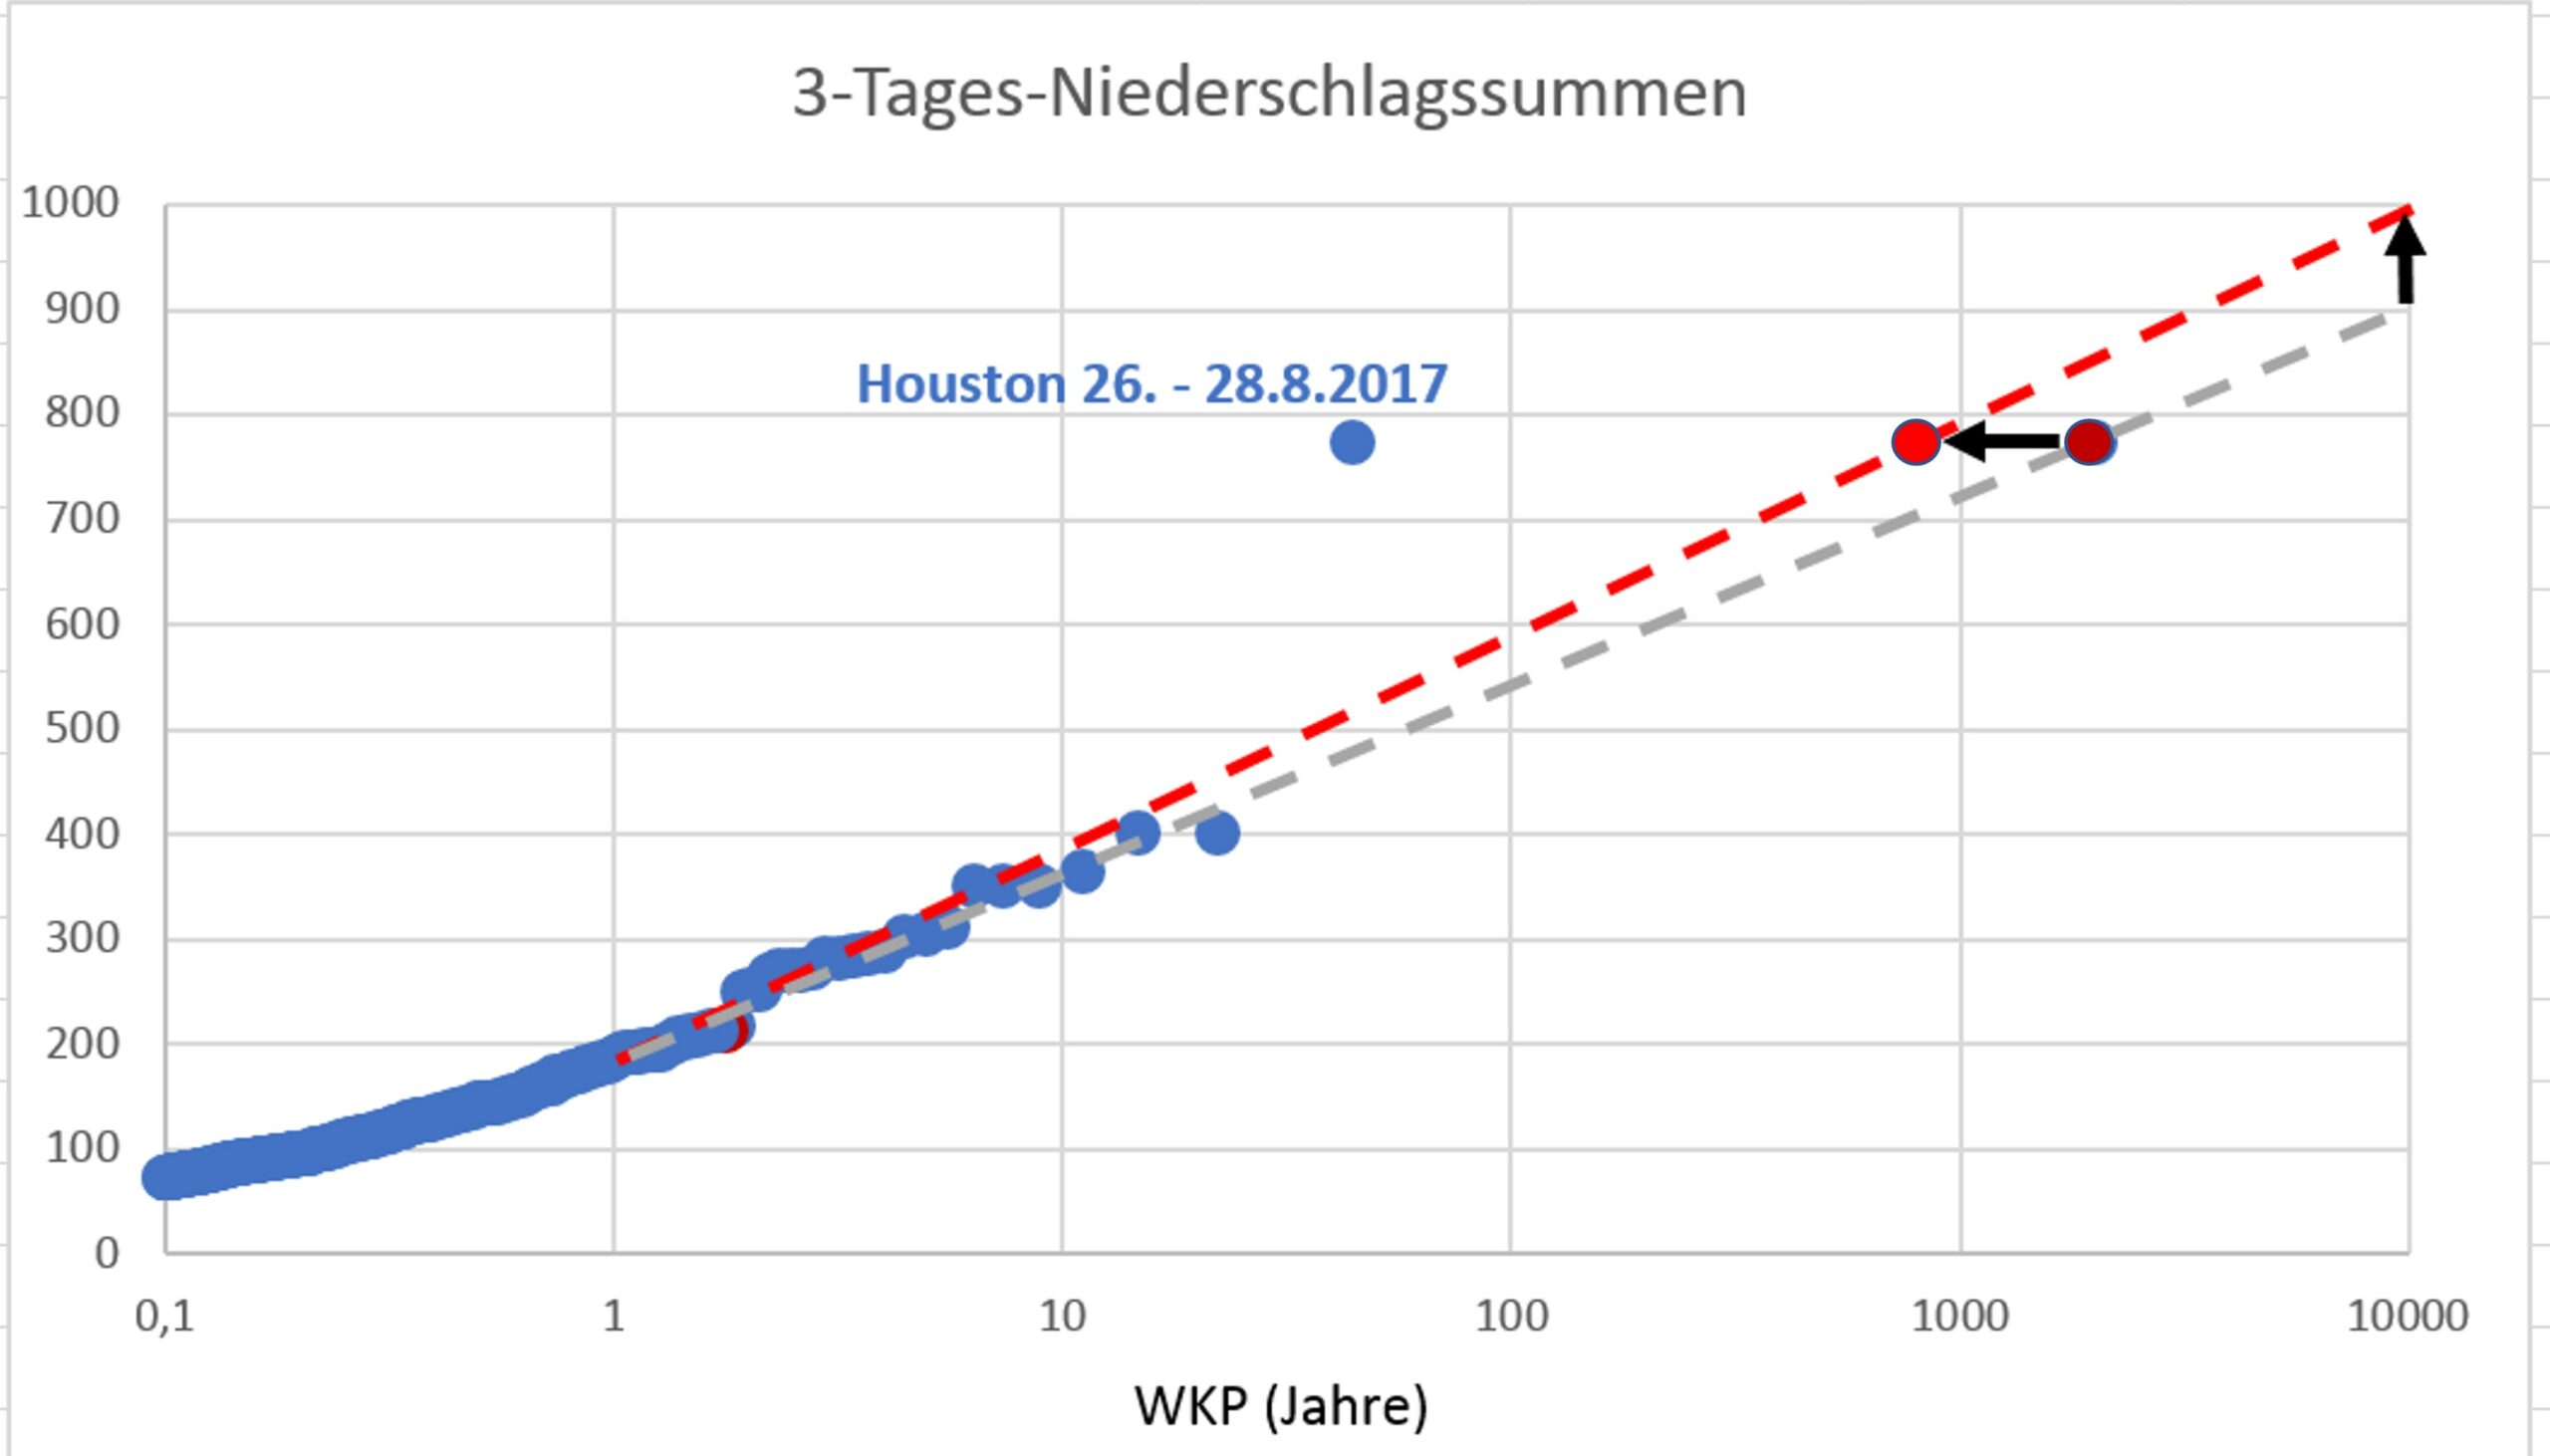
Fig. 7 Possible shift of the precipitation totals on the example of
Houston
Conclusion and outlook
Our study on heavy rain shows that the maximum possible precipitation in different parts of the world depends on a large number of parameters and that even minor climatic changes can have a major impact. Above all, in the context of global climate change and the resulting risks of change, we continue to deal intensively with this topic.
In 2018, the Köln.Assekuranz Agentur has implemented a model to identify the risk of heavy rainfall and to assess the risk in the usual way, in a comparable manner worldwide. It is also possible to make statements about the future heavy rainfall risk based on climate projections up to the year 2100.
If you would like to discuss this paper with us, we look forward to hearing from you.
