In the tropics the question is superfluous, but already in temperate latitudes the problem will certainly arise again in the coming winter months: What snow loads can be expected and can the roof withstand possible extreme loads?
Internationally operating companies in particular are faced with these questions when warehouses have to be rented or newly built far from the company headquarters. The official regulations vary widely from country to country and are often not very reliable.
KA Köln.Assekuranz Agentur GmbH has taken on these problems and found solutions.
Summary
Compared to other natural hazards, the issue of snow load is a misunderstood quantity. Around the globe, there have been and still are repeated threatening situations and serious catastrophes caused by snow loads. The fact that official specifications for the load-bearing capacity of roof structures follow economic rather than scientific principles has contributed to this in particular. Against this background, it is almost impossible to assess the actual risk of accidents in real terms.
The K.A.R.L.® information system of KA Köln.Assekuranz Agentur GmbH closes this gap by offering global orientation values of possible maximum snow loads via K.A.R.L. analyses.
In addition, detailed risk analyses based on regional weather data can be commissioned for individual locations. An example of this is presented using the city of New York.

Such situations do not always end smoothly. The winter of 2005/2006, for example, is still considered a particularly dark chapter in the history of accidents caused by snow loads. It began on January 2nd 2006 with the collapse of the ice rink in Bad Reichenhall, Bavaria, in which 15 people lost their lives. As it turned out later, the load of snow on the roof of the hall was only medium. As it turned out later, the load of snow lying on the roof of the hall was only an indirect cause of the disaster, because the weight of the snow had not yet exceeded the limit for which the hall roof was structurally designed. However, in combination with construction defects that were discovered by experts during subsequent examinations, the disaster was, in a sense, pre-programmed.
Only a few weeks later, the roof of a trade fair hall in Katowice, Poland, collapsed and buried as many as 65 people. Here, too, building defects were suspected as the cause of the tragedy. While these events were still considered isolated incidents, the situation changed shortly afterwards when numerous roof trusses in many places in Bavaria, Upper Austria, Styria and Lower Austria collapsed under large masses of snow. The winter of 2005/2006 has remained an unpleasant memory for many emergency services, fire brigades and military, and has also shown that the actual snow loads can considerably exceed the maximum expected values.
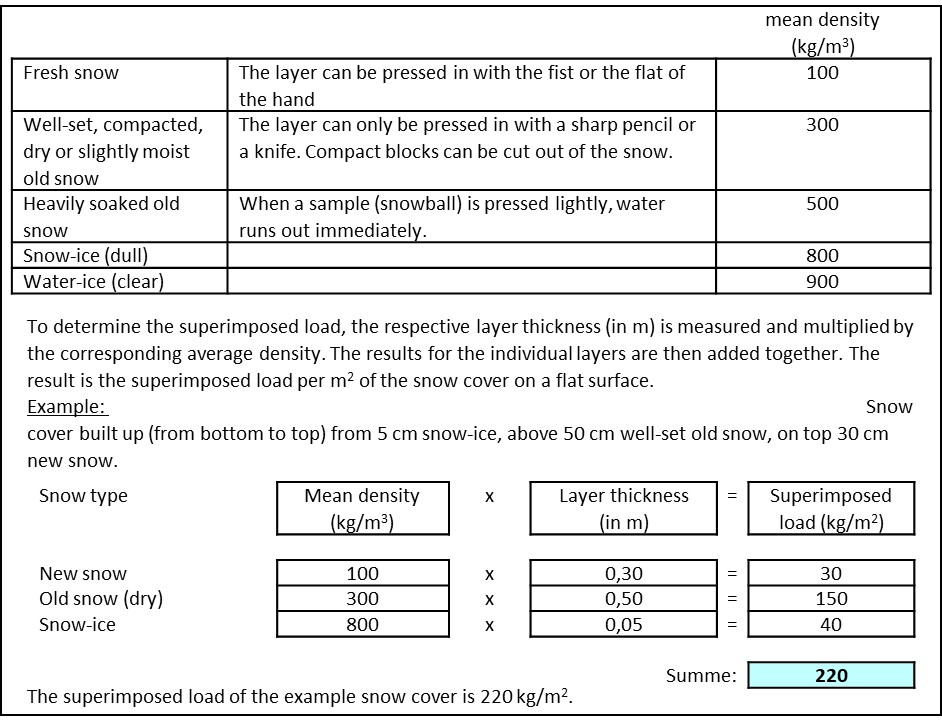
Unfortunately, the weight of the snow masses that have piled up on the roofs overnight is not immediately apparent. In particular, the density of the snow, which can vary between 100 kg/m³ for freshly fallen powder snow and 900 kg/m³ for clear water ice, plays an important role here. The avalanche warning centre at the Bavarian State Office for the Environment has published the following guideline values and calculation examples, which can be used to estimate current snow loads.

Half a metre of dry old snow on the roof of a garage of about 10 square metres can weigh around 1.5 tons, which is about the same as the weight of the car underneath.
Stocktaking – Official guidelines vary greatly
For economic reasons, the snow loads prescribed by national and regional building codes, for which the supporting structures of buildings must be designed, are often well below the maximum possible snow loads. In many areas it is even unclear whether the maximum values are even known or whether anyone has ever taken the trouble to calculate them in a scientifically comprehensible way. In the case of the warehouse mentioned above, whose walls had buckled under the weight of the snow, the regional permissible snow loads were unceremoniously increased by almost 30 percent after the winter of 2011. Whether this will be sufficient for the future or whether it was just a politically motivated action is unclear.
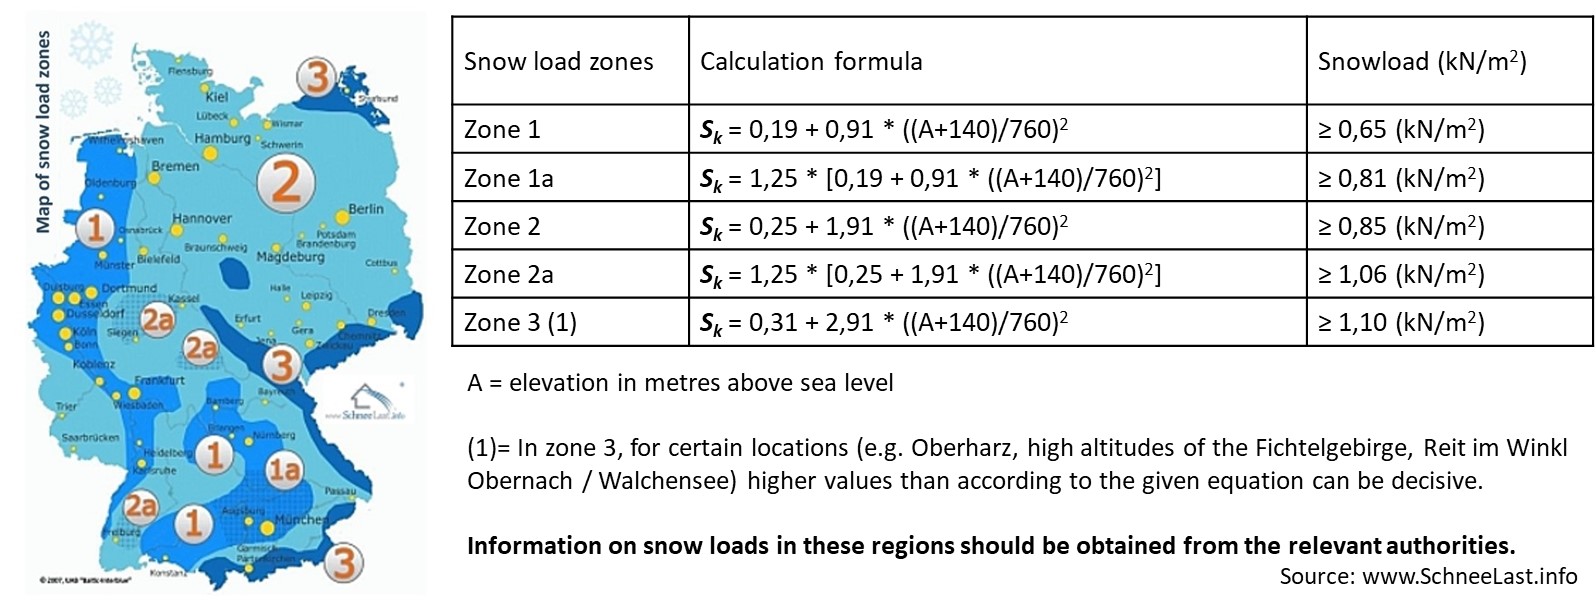
As a global research carried out by KA Köln.Assekuranz Agentur revealed, the approaches used to determine the structural design of buildings with regard to snow loads are highly diverse in international comparison. To be found are: empirical values or maximum observed loads, „characteristic snow loads“ (whatever that means), 50-year snow loads statistically determined from weather data, as well as maps with snow load zones, from which the concrete values for individual locations can then be calculated – sometimes, however, with quite a few exceptions. This method is used in Germany, for example.

In many cases, the background and methods used for these determinations can no longer be reconstructed. Occasionally, however, one encounters scientifically sound approaches according to which expected maximum snow loads were determined on the basis of concrete weather data and comprehensible models.
Unfortunately, the conclusion of this inventory can be summarised as follows: In addition to serious scientific calculation methods, political and economic influences, carelessness as well as exaggerated caution or even bad or completely missing experience obviously play a major role. Seen worldwide, the spectrum of permissible maximum snow loads is therefore extraordinarily broad and confusing.
What can be expected? – A global approach to solutions
On the basis of global climate data (long-term average monthly precipitation as well as monthly maximum and minimum temperatures), KA Köln.Assekuranz Agentur GmbH developed a global analysis model for the snowfall-relevant areas, with which the presumably expected maximum snow loads can be determined for every point on earth. A sample of 90 official snow load specifications from the USA, Canada, Europe, China, Korea and Japan was used to calibrate the model. Care was taken to ensure that the sample elements covered as many different climatic zones and topographic height ranges as possible, as well as coming from reliable official sources.
Based on the previous surveys, it was not to be expected that the model-calculated snow loads could be clearly correlated with the compared official snow load data, despite careful sample selection. Rather, a relatively wide range of variation is evident, for which the non-scientific influencing factors described above are most likely responsible. This means that under comparable climatic conditions, the officially specified snow loads can deviate from the model-calculated mean values by up to 30 %. In areas where either very little or particularly much snow falls naturally, even greater percentage deviations can be observed.

In order to be able to represent these conditions completely, we have created three snow load models, each of which is oriented towards the lower and upper limits as well as the mean value of the correlation between the snow loads calculated by us on the one hand and the officially specified snow loads on the other. The results of these model calculations can be reproduced as world maps of expected maximum snow loads (Fig. 4). K.A.R.L. bases its information on the data sets presented there. The model variants are to be understood as follows:
Lower Limit:
95 % of the officially prescribed limit loads from different regions of the world exceed this value. The load-bearing capacity of roof structures should therefore always be above this lower limit load.
Mean:
This reflects the consensus between the recommendations found. Depending on the climatic conditions at an examined location, approx. 50 % of the officially specified snow loads would be above and 50 % below this value. If the official specifications or the load-bearing capacity of a hall roof are below this value, caution is definitely advised. If, on the other hand, they are higher, one can at least assume that the snow load in question is only rarely reached or exceeded, because the calculated average value already tends clearly towards the safe side due to individual very high snow load specifications that have been included. However, absolute safety is still not given.
Upper Limit:
95 % of the recommendations evaluated in the sample are below this value, i.e. one is already very far on the safe side. Official specifications that reach or even exceed this snow load are in the range of worst-case assumptions or are either an expression of particularly bad individual experiences or excessive caution.
Table (Fig. 5) shows some comparisons of official snow load assumptions and K.A.R.L. results for the corresponding locations.

As is unfortunately the case in many places around the world, the officially specified snow loads in Cologne, Munich and New York are close to the lower limit of what is considered possible in an international comparison elsewhere under similar climatic conditions. In Innsbruck, Beijing and on the Zugspitze, on the other hand, the problem seems to have been approached somewhat more cautiously, as the specifications there are more in the range of the maximum to be expected.
It can be more precise – Detailed weather data analysis
Thanks to a large number of weather stations operated worldwide, where temperature and precipitation values are documented daily, the accuracy of these statements can almost always be considerably improved locally. The scientific evaluations required cannot be automated, however, because the station data in question must be selected manually and checked for quality. If, for example, the station data covers a period of less than 30 years, has gaps or contains either only temperature or only precipitation data, it cannot be used to calculate snow loads.
On the other hand, uninterrupted and sufficiently long weather records allow the following course to be followed quite precisely: The snow accumulates from day to day at the beginning of winter, thaws completely or only partially in between, is replenished by renewed snowfall, until it finally melts away completely in spring. That being said, the data do not provide any information on whether the snow was cleared e.g. by sunlight, or remained in place due to a protected shaded area.
Therefore, several variants must also be calculated for this method, whereby the version of particular interest is the one in which the snow piles up particularly high under corresponding microclimatic conditions and melts very slowly. This gives the worst-case solution. More snow than calculated in this way can hardly accumulate on a roof.
Example: New York in the winter of 1993
In the months of February and March 1993, the city of New York was hit particularly hard: After it had snowed only a little in January, the snow masses piled up higher and higher in the course of February. Only on a few days did the temperature rise above freezing point, so that hardly any of the white snow melted. The real catastrophe, however, was to come a month later. On two days, March 13th and 14th, about 63 mm of precipitation fell during a snowstorm at temperatures just below freezing. This corresponds to about two-thirds of the amount of precipitation normally expected in New York throughout the month.
On these days, about 60 cm of new snow was piled up on top of the hardened old snow of the previous months, so that that the snow cover grew to about 1 metre in places that had not been cleared in time. On some roofs, the snow now weighed more than 100 kg/m².
The blizzard that brought this severe weather to New York has gone down in history because it hit the entire east coast of the USA and left a snow cover of over 20 cm even in the deep south. In Florida and Cuba, there was no snow, but a storm with wind speeds between 160 and 210 km/h was recorded. In New York, the snow melted after about two weeks due to the warm air on the back of a low-pressure system.
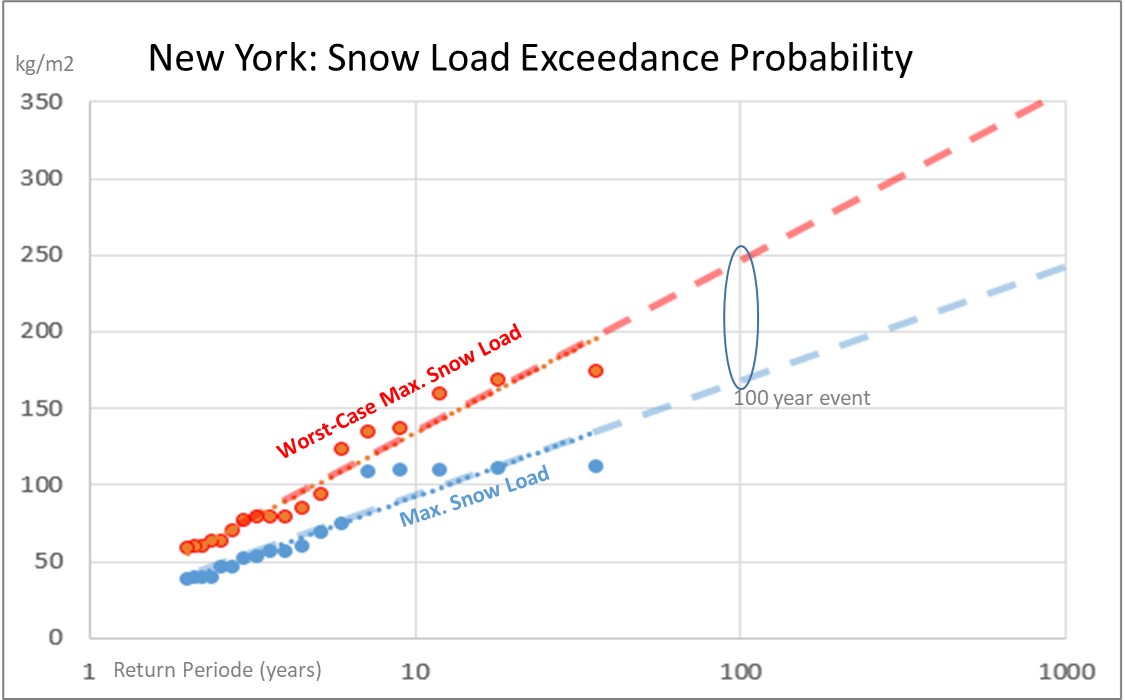
Based on the weather records of the measuring station at La Guardia Airport, the increase in snow load can be traced step by step over the course of this winter (blue curve, Fig. 6).

Under unfavourable conditions, however, it could easily have been even worse. This is shown by the red curve, in which the snow conditions in New York were calculated assuming the most unfavourable conditions imaginable. So it is quite possible that some roofs even had to withstand a load of almost 180 kg/m².

For New York, the winter of 1993 was not an isolated case, as can be reconstructed from the weather data of the La Guardia station for the period from 1977 to 2014: Comparably unpleasant snow conditions also occurred in 1977, 1994, 2011 and 2014. The harsh winter of 1994 in particular had even more far-reaching consequences just one year later. The immense demand for road salt on the US East Coast could hardly be met. Therefore, salt mining was pushed so drastically in the short term that the mine became unstable and collapsed.This caused large amounts of groundwater to seep into the mine. As a result, salt extraction had to be stopped completely and was not resumed at this location.
The snow load risk is calculable
Collapsing roofs are therefore not the only problems that can be caused by extreme winter weather. Hand in hand with unexpectedly high snow loads go other risks that can arise from impassable transport routes, frozen ports and rivers, temporary collapse of the energy supply, accidents on slippery roads and even the collapse of entire mines.

The scientific analysis of the weather data at La Guardia Airport also confirms the K.A.R.L. result already mentioned above that the officially specified maximum snow load of 96 kg/m² is far too low; a shortcoming that New York unfortunately shares with many other cities and regions around the world. According to the statistics shown above, 96 kg/m² are reached or even exceeded here at least every 10 years. In contrast, the average maximum snow load of 224 kg/m² derived by K.A.R.L. from global empirical values seems much more realistic. This would be expected in a „ once in a century winter“ and should also be reckoned with in a realistic situation.
This means: Careful observation of the snow conditions and immediate clearing of the roof surfaces if, as in New York, they are only designed for a load of just under 100 kg/m². Otherwise, the probability of failure would be 10 percent (1 time in 10 years). With a load-bearing capacity of 200 kg/m², on the other hand, one would already be prepared for a winter of the century in this example and the probability of failure would then only be 1 percent.
If you don‘t want to be surprised by a flood of the century or a storm of the century, you should also apply appropriate standards when it comes to the load-bearing capacity of your roof and be prepared for the resulting risk.
The K.A.R.L.® information system of KA Köln.Assekuranz Agentur GmbH supports you in this by providing orientation values of the maximum possible snow loads for every point on earth. A team of experts is also available for detailed site analyses based on specific weather data.
