A representative view of the town of Nörvenich
Heat and drought were already the number one topic in the media in 2018: Not only parts of Germany groaned under the unusual weather, it was also extremely hot and dry elsewhere: In Greece, forest fires claimed over 100 lives, in Japan, July delivered record temperatures, and in California and Portugal, wildfires were barely under control. Were we dealing with an exceptional year in 2018, or was the weather a signal of global climate change? We want to take a closer look at this question here.
Thousands of weather stations worldwide show the same picture: temperatures have been rising steeply for years. Heat records drop. Although this trend is not evident to the same extent everywhere, it can however be detected all over the globe. One of these stations which has been providing reliable weather data for decades is located west of Cologne at Nörvenich military airport. Although what is measured here is not representative of Germany, Europe or the whole of the world the data is characteristic of the trend that is emerging almost everywhere: as the weather can change from year to year – sometimes there is a hot year, sometimes a cooler one; this is what we notice in central Europe – you are hardly aware of what‘s going on in the background, namely that the hot years are getting hotter and the cool becoming ever rarer. An average temperature rise of 0.043 °C per year can not be felt by humans.
The trend (blue dotted line) can not be foreseen until you take a look at the overall course of the temperatures over several decades: in the 1970s, the average annual mean temperature in Nörvenich was still below 10 °C, today we have already reached over 11 °C . Such temperatures were expected 45 years ago in the Baden wine-growing regions 300 km south of Cologne, but not in the Rhineland; and if there is no change to this trend, the 12 °C mark will be exceeded here in just over 20 years.
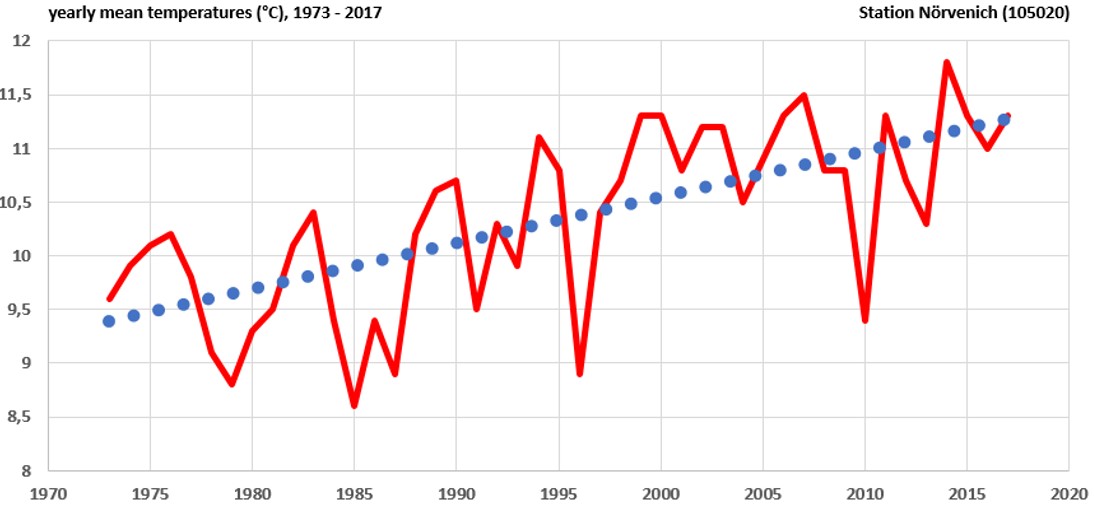
Fig. 1 Annual mean temperatures at Nörvenich station since 1973
Annual mean temperatures1 are made up of 365 individual daytime temperatures. How many and which of them are called heat days is a matter of definition. In meteorology, it has been agreed to designate a day as a summer day when the maximum daily temperature breaks the 25 °C mark. On a so-called heat day, the corresponding limit is 30 °C. That was the case in Nörvenich since the beginning of the heatwave in the months of June / July on almost every day. With the exception of four slightly cooler days in the first half of July, all other days of this month also showed averages of 20 °C and more. In the last days of July, mean values of more than 25 °C were measured. In this case, after daily maximum temperatures of well over 30 °C, not even the night temperatures dropped below a value of 20 °C. This is what meteorologists call „tropical nights“.

Fig. 2 Increase in daily mean temperature at Nörvenich station since January 2018
Taking the daily mean temperature2 of 20 °C as a criterion for a „hot day“ (the experience of recent weeks confirms that quite clearly!), it can be clearly seen at the weather station Nörvenich that their number has increased significantly in the last 45 years. While this averaged 16 days from 1973 to 1983, it had nearly doubled to 28 days per year between 2008 and 2017.

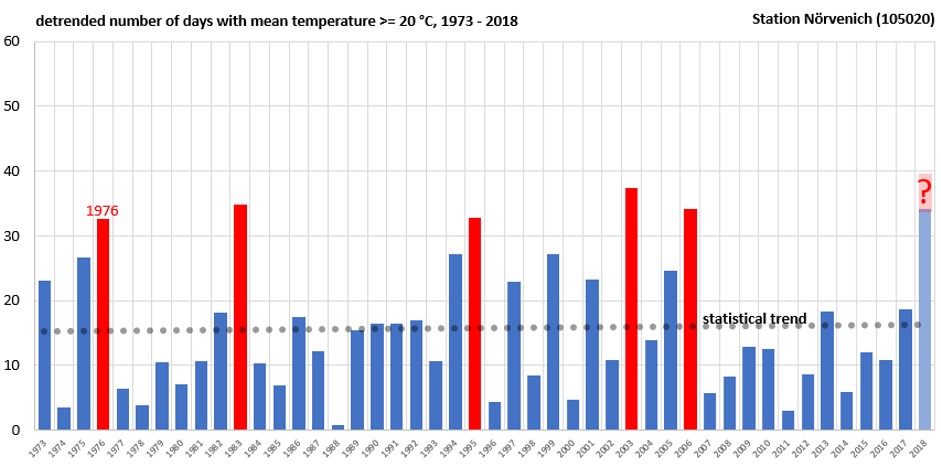
Fig. 3 Number of days since 1973 with a mean temperature of 20 degrees or higher. The statistical trend and the model calculation both show an increase
Originally, the year 1976 was the benchmark for a significant heat year. It had 34 days with mean temperatures of 20°C or more. That was quite impressive for the time. In the magazine DER SPIEGEL (05.07.1976) it said:
„Heatwave – Like old-time plagues
Scarring nature, sweaty citizens: Europe had the hottest June in living memory. Road surfaces burst, stock market prices sank, whales in the zoo were threatened with sunburn. While city dwellers were attacked, billions of dollars were damaged in the countryside. And not only the umbrella manufacturer association was pleading for rain.“
The record did not last long. With 39 heat days this record was broken in 1983 at least in Nörvenich. Although 10 cooler years later followed, between 1976 and 2018 the year 1976 was beaten ten times. This also includes the extreme summer of 2003, which is one of the worst natural disasters of all time with 70,000 heat deaths in Europe3. With 50 days with at least 20 °C, the year 2003 so far leads the statistics of the station Nörvenich. However, this heat wave was not evident everywhere to the same extent: in Munich-Riem there were even 15 hot days more than in Nörvenich, whereas compared to the East Frisian Wittmund there was a tolerable warm summer with only 23 heat days.
The year 2018, however, prepared to clearly break the record of the year 2003: By 08.08.2018, 56 heat days had already been counted in Nörvenich. This broke, at least in Nörvenich, the previous record of 2003. But something else differentiates the 2018 heat wave from 2003: at that time only Europe was affected, in 2018 comparable weather conditions could be found on other continents at the same time.
But how can it be explained that a comparatively small increase in the annual mean temperature of less than 2 °C within 45 years (climatologists consider that that already means a lot!) leads to an almost doubling of the hot summer days?

Fig. 4 Effect of a temperature rise of 2 degrees using the example of Nörvenich
The temperatures of the days of any month – for the example shown below was chosen in May 2000 – are normally distributed. This means there may be a few frosty days in May and even temperatures of 30 °C although very rare are not impossible. These are the two bases of the green bell-shaped distribution curve. However, most May days conglamorate around the mean, which is around 13.5 °C, which is the peak of the distribution curve. The area above 20 °C (yellow area) accounts for about 11.6 % of the total area under the curve. Since May has 30 days the statistical average at the turn of the millenium was about 3.5 hot May days.
According to the climate model operated by NCAR4, it can be assumed that the May temperatures in the Nörvenich region will rise by approx. 1.8 °C by the year 2040 compared to the year 20005. Thus, the entire bell curve shifts by this amount to the right, which, however, at the same time significantly increases the „space“ below the red curve in the range of temperatures beyond 20 °C (orange area): from 3.5 hot May days there are suddenly six hot May days; here almost doubling.
In combination of the climate data used in K.A.R.L. and the NCAR climate model, we used this method to calculate how many heat days per year between 1973 and 2018 in the Nörvenich area would have been expected approximately. As shown in Fig. 3, the model here comes to a slightly more pessimistic assessment than the evaluation of the measured weather data, but the magnitude corresponds to reality and the trand, calculated via the climate model, shows almost exactly the same increase as the statistical trend derived from measured data.
If the results of climate models and real observations can be so clearly reconciled, then only one conclusion can be drawn: climate change plays an important role in the increasing frequency and intensity of heat waves.
As the increasing trend is clearly due to climate change, this finding can be used to separate random extreme events from the general increase in temperatures. For this purpose, we have adjusted the measured heat days by the statistical trend derived from the measured data and can thus reconstruct how the course of cool and hot summers in Nörvenich could have developed presumably without the influence of climate change.
Comparing the two figures 3 and 5 they clearly show that without climate change significantly less hot summers would have been expected: as extreme events that surpass the legendary record summer of 1976, probably only the years 1983, 1995, 2003 and 2006 remained. The 2018 heat year also falls into this category.
Back to the original data: If you look only at the last 30 years since 1988, the statistical return period of a heat summer would have been in Nörvenich at 7.5 to 10 years, depending on whether you include the year 2018. On the other hand, the reality is quite different: according to Fig. 3, there were 10 summers (including 2018) during this period, which were in part the same as those of 1976, which clearly exceeds this. Thus, the statistical recurrence period is actually 3 years. All the risks associated with extreme heat spells – crop failures, water scarcity, forest and bush fires, limited transportation by low water in rivers, failure of air conditioning systems, shortages of energy supply, etc. – would have nearly tripled anywhere where the situation roughly coincided with that in Nörvenich.
To return to the initial questions: extreme heat spells are normal, they have always been, but they were rare. Therefore, climate change can not be blamed for individual outliers such as 1976, 2003 or 2018. By contrast, it is NOT NORMAL that hot summers have noticeably increased in the last 35 years, and their intensity has clearly increased with regard to the number of hot days. The collective of events thus proves the influence of climate change, but not a single event. Heat years like 1976, 2003 or even 2018 can therefore still be regarded as exceptional, but without climate change they would certainly have been a bit more lenient.
Although Nörvenich is not the center of the universe, but a good example of what is currently happening not only in Germany and Europe but also on other continents: the consequences of climate change are becoming more noticeable, but not everywhere with the same force and not in each year, but they are more and more in the foreground. Insignificant increases in temperature of 0.04 °C per year will double the hot summer days over the medium term, tripling the risks of heat, drought and crop failure as well as the increasingly occurring wildfires. In addition, further consequences of climate change, such as frequent downpours, flash floods and hailstorms will therefore continue to be the focus of further development of K.A.R.L.
If you would like to exchange information with us about this paper, we look forward to hearing from you.
Visit our website at www.koeln-assekuranz.com
¹ The mean annual temperature of a location, also referred to as the annual average temperature, is calculated from the average of the twelve monthly mean temperatures
² The daily mean temperature, also daily average temperature, is determined in Germany by the German Meteorological Service since the 1st of April 2001 by forming the mean value of all air temperature values measured from 0 to 23 clock UTC
³ This value was published in 2007 at a conference of the World Health Organization in Bonn; Source: SPON 23.03.2007
⁴ National Center for Atmospheric Research, Boulder CO
⁵ Medium A1B Scenario, 2000 to 2099